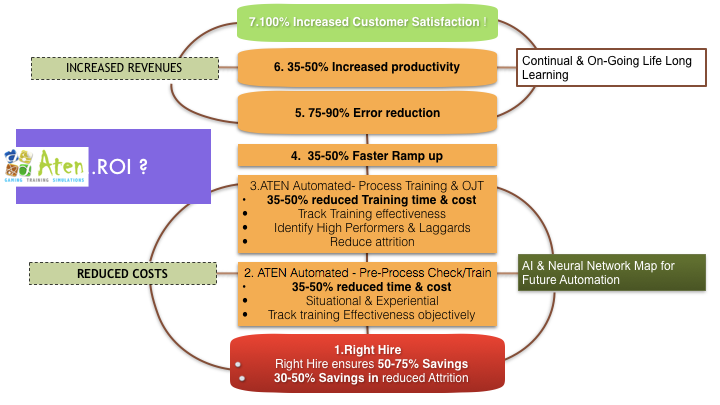
ATEN AI & DATA DRIVEN TRAINING ROI
YEAR OVER YEAR & 5 YEAR ROI
REDUCED TRAINING COSTS(%) & ATTRITION(%)
INCREASED REVENUES & PRODUCTIVITY
| 5 YR CUMULATIVE ROI $3,203,621 |
PER YEAR AVERAGE ROI $640,724 |
5 YR ROI % $641% |
| 5 YR CUMULATIVE INVESTMENT $500,000 |
ANNUAL INVESTMENT $100,000 |
ANNUAL ROI $641% |
Year 1 |
Year 2 |
Year 3 |
Year 4 |
Year 5 |
Total |
|||||||
|---|---|---|---|---|---|---|---|---|---|---|---|---|
| Investment | New Users (calculated Basis attrition rate and expected growth) | 200 |
198 |
206 |
213 |
231 |
1048 |
|||||
| Your cost | $ 100,000 |
$ 100,000 |
$ 100,000 |
$ 100,000 |
$ 100,000 |
$ 500,000 |
||||||
| Benefits | Reduced training cost | $ 11,950 |
50% |
$ 35,635 |
65% |
$ 44,253 |
75% |
$ 45,814 |
80% |
$ 49,766 |
80% |
$ 187,418 |
| Reduced Attrition cost | $ 11,408 |
5% |
$ 16,941 |
8% |
$ 23,466 |
10% |
$ 24,294 |
10% |
$ 26,390 |
10% |
$ 187,418 |
|
| Increased revenue (Due to reduction in training period) | $ 316,000 |
50% |
$ 312,840 |
60% |
$ 325,006 |
65% |
$ 336,477 |
70% |
$ 365,498 |
75% |
$ 1,655,821 |
|
| Increased productivity | $ 140,000 |
5% |
$ 207,900 |
8% |
$ 287,980 |
10% |
$ 298,144 |
10% |
$ 323,859 |
10% |
$ 1,257,883 |
|
| Your Benefits | $ 479,358 |
$ 573,316 |
$ 680,705 |
$ 704,729 |
$ 765,513 |
$ 3,203,621 |
I had been in discussions with the Business Head for one of our older Customers. We were brainstorming to create a business case within their Organization to internally showcase the efficacy of moving away from archaic instructor led training to a NextGen, Automated, Artificial Intelligence driven , Analytical & Personalized Learning Platform.
Organization, & our collaborative BPR approach to this viz. we decided that we needed to take this a step further and try and put some numbers to each of these to calculate a realistic Return on Investment ( ROI ) Model . So there I was poking away at my Mac on a beautiful Fall Friday evening at 9 pm ! That was when my model totaled up the calculations and I literally fell off my chair ! I swear I should have done this 10 years back !
While we had been waxing eloquent about the ROI to our customers for ages and in sweeping statements, this was the first time we really broke down at least the tangible benefits to put a monetary value to each .
The numbers were mind blowing ! Let’s look at a hypothetical example : For Company X with
- Revenues of $1 Billion, and
- an average employee cost of 35% ,
- with around 5000 employees, spread globally
- Annual attrition rate of 11%
- Annual new hire rate of 12%
| ROI | USD/Employee | Potential for your division |
|---|---|---|
| Potential Savings | $3,446 | $6,175,950 |
| Potential Increased Revenue | $53,117 | $59,505,059 |
| Total Potential Savings + Increased Revenue / year | $56,563 | $65,681,009 |
That is when it really struck me ! Its not just a savings or benefit . It is a COST , or A LOSS ! - “ The Cost of delayed Innovation / Automation of Training ” ! For every minute, every hour, every month you wait, to make this change to such a research proven , way more effective & efficient, AI data & analytics driven Next-Gen Personalized Learning Platform, you are in effect losing money - and significantly at that ! What is your loss or Cost of delayed Innovation / Automation of Training ? Calculate yours & feel free to play around with the model available.
| Hourly | |||||
|---|---|---|---|---|---|
| Avg. Call Center Employee CTC | $368,000 | $184 | |||
| Avg. Trainer CTC | 829,000 | $415 | |||
| Avg. Admin CTC | 25% | $104 | |||
| Per Employee revenue p.a | $14,000 | ||||
| Total Sample Customer Revenue for current # | $2,800,000 | $4,000 | |||
| Total Sample Customer employees | 400 | ||||
| Total Sample Customer Revenue | $533,000,000 | ||||
| Total Sample Customer Employee Costs for current # | 720,000 | ||||
| Total Sample Customer employees | 400 | 440 | 484 | 532 | 586 |
| Total Sample Customer employees for POC | 200 | 198 | 206 | 213 | 231 |
| Annual Hours/Employee | 2000 | ||||
| Avg. Earnings per hour/ employee | $10 | ||||
| Annual new hires | 35% | ||||
| Billable Work days /Week | 5 | ||||
| Billable Work Hours/Day | 8 | ||||
| Today | 12-12-2017 | ||||
| Total Employee Costs estimate for Sample Customer | 2,716,698 | ||||
| Per employee Cost for Sample Customer | 3,600 | ||||
| Employee costs % | 34 | ||||
| Trainees /Trainer | 10 | ||||
| Retrained employees | 20% | ||||
| Replacement costs per employee ( Estimated Avg. Industry % ) | 20% | ||||
| Number of billable weeks per year | 50 | ||||
| Annual Attrition % | 35% | ||||
| Time taken to train in weeks including PreProcess+Process+ OJT | 12 | ||||
| Average # | % reduction | Cost Savings/Employee assuming 10 per batch | Cost Savings for new employees assuming 35% new hires | |
|---|---|---|---|---|
| Effectiveness impact | ||||
| Trainer Costs | $198,720 | 50% | $9,936 | $993,600 |
| Admin/OH Costs @ 25% of Trainer costs | $49,680 | $2,484 | $248,400 | |
| Cost to retrain employee at OJT level assuming 20% need retraining | $497 | $49,680 | ||
| Cost to review & monitor during weeks 3 OJT | $49,680 | 80% | $2,484 | $248,400 |
| Total Savings Year 1 | $298,080 | $15,401 | $1,540,080 | |
| Total Savings Year 2 | $1,540,080 | |||
| Total Savings Year 3 | $1,540,080 | |||
| Total Savings Year 4 | $1,540,080 | |||
| Total Savings Year 5 | $1,540,080 |
| % Reduction | Replacement Cost / Employee | Annual attrition rate reduction by 50% | USD | |
|---|---|---|---|---|
| Employee replacement costs @20% CTC | 25% | $73,600 | 5% | $78,826 |
| Total Savings year1 | 5% | $78,826 | ||
| Total Savings year2 | 8% | $78,826 | ||
| Total Savings year3 | 10% | $78,826 | ||
| Total Savings year4 | 10% | $78,826 | ||
| Total Savings year5 | 10% | $78,826 |
| Added Productive Weeks # | % reduction | Increased billing per employee | Assuming 35% new hires | |
|---|---|---|---|---|
| Increased Revenue by Ramp up reduction | 6 | 50% | $2,400 | $336,000 |
| Reduced ramp up Total Year 1 | $2,400 | $336,000 | ||
| Reduced ramp up Total Year 2 | 60% | $2,400 | $336,000 | |
| Reduced ramp up Total Year 3 | 65% | $2,400 | $336,000 | |
| Reduced ramp up Total Year 4 | 70% | $2,400 | $336,000 | |
| Reduced ramp up Total Year 5 | 75% | $2,400 | $336,000 |
| % reduction | Increased billing per employee | Increased USD Billing for Company | |
|---|---|---|---|
| Increased Revenue by Ramp up reduction | 5% | $1,000 | $400,000 |
| Total | $1,000 | $400,000 |
| % reduction | Increased billing per employee | Increased USD Billing for Company | |
|---|---|---|---|
| Increased Productivity Savings | 5% | $1,000 | $400,000 |
| Total Productivity Savings Year 1 | 5% | $1,000 | $400,000 |
| Total Productivity Savings Year 2 | 8% | $1,000 | $400,000 |
| Total Productivity Savings Year 3 | 10% | $1,000 | $400,000 |
| Total Productivity Savings Year 4 | 10% | $1,000 | $400,000 |
| Total Productivity Savings Year 5 | 10% | $1,000 | $400,000 |
| % reduction | Increased billing per employee | Increased USD Billing for Company | |
|---|---|---|---|
| Increase in Biz owing to increased Customer Confidence | 5% | $1,000 | $400,000 |
| Total | $1,000 | $400,000 |
*** PLEASE NOTE THAT THESE ARE MERELY HYPOTHETICAL FIGURES AS POSSIBLE SAVINGS AND NOT A GUARANTEE OF ANY KIND . EACH CLIENT SITUATION WILL DETERMINE THE OUTCOME ***